TST Nexus Indicator — Official User Guide & Workflow Manual
Tradingview Toolkit User Manual

Use TST Nexus With a Clear Plan.

Learn how to access, add, and use TST Nexus on TradingView. This user manual explains the visual dashboard, circle and triangle markers, strategic step-by-step workflow, alerts, FAQ, troubleshooting, and direct support.

Video Walkthrough & Setup Tutorial

Watch this step-by-step video tutorial to understand how to connect your credentials, sync with TradingView, and read the on-screen dashboard context effectively.

Step 1

Getting Access

Welcome to TST Nexus — a visual trading indicator designed to help you read market conditions, follow developing setups, and keep your chart analysis more organized. TST Nexus is an educational charting tool designed to support your analysis, not replace your own judgment, trading plan, or risk management.

After purchasing TST Nexus through Whop, your access will be connected to your TradingView account. To access the indicator, follow these instructions step-by-step:

  1. Log in to your Whop account.
  2. Connect your exact TradingView username inside Whop.
  3. Once your purchase is active, TradingView access will be granted automatically.
  4. Open your charting window on TradingView.
  5. Go to the top menu and select Indicators.
  6. Look on the left column under Invite-only Scripts.
  7. Select TST Nexus and click to add it to your active chart.
Having issues? If you do not see the indicator inside your Invite-only folder after purchase, contact us through Whop Chat.
Step 2

Recommended Setup

For your first use, we recommend keeping your chart clean and simple. Follow this baseline configuration:

Display Mode: Beginner

Keeps the dashboard interface simplified, showing only the essentials to keep your focus clean.

Dashboard Position: Top Right

The optimal visual layout position to avoid covering current candles and price action details.

Recommended First Setup on Chart
  • Start clean and with a completely simplified chart background.
  • Add extra tools or indicators only when needed.
  • Beginner Mode is the best starting point because it keeps the dashboard simple and easy to read.
Step 3

Display Modes

TST Nexus includes three display modes to control the complexity of the information on your screen. You can customize this directly in the indicator settings menu:

Mode A

Beginner Mode

A clean, distraction-free dashboard panel showing core market data. Perfect for traders who want to focus purely on basic trends, clean chart markers, and simple setup structures.

Mode B

Pro Mode

A highly detailed structural dashboard with extra context. Displays complex variables including Market Phase, local breaks, Fair Value Gaps, Order Blocks, and advanced range markers.

Mode C

Off

Completely turns off the visual dashboard panel overlay. Choose this if you only want to view the raw chart markers, candlestick structures, and price levels on your screen.

Display Mode Options

*Note: You can also choose where to position the dashboard directly on your screen: Top Right, Bottom Right, or Bottom Left of your chart.*

Step 4

Dashboard Overview

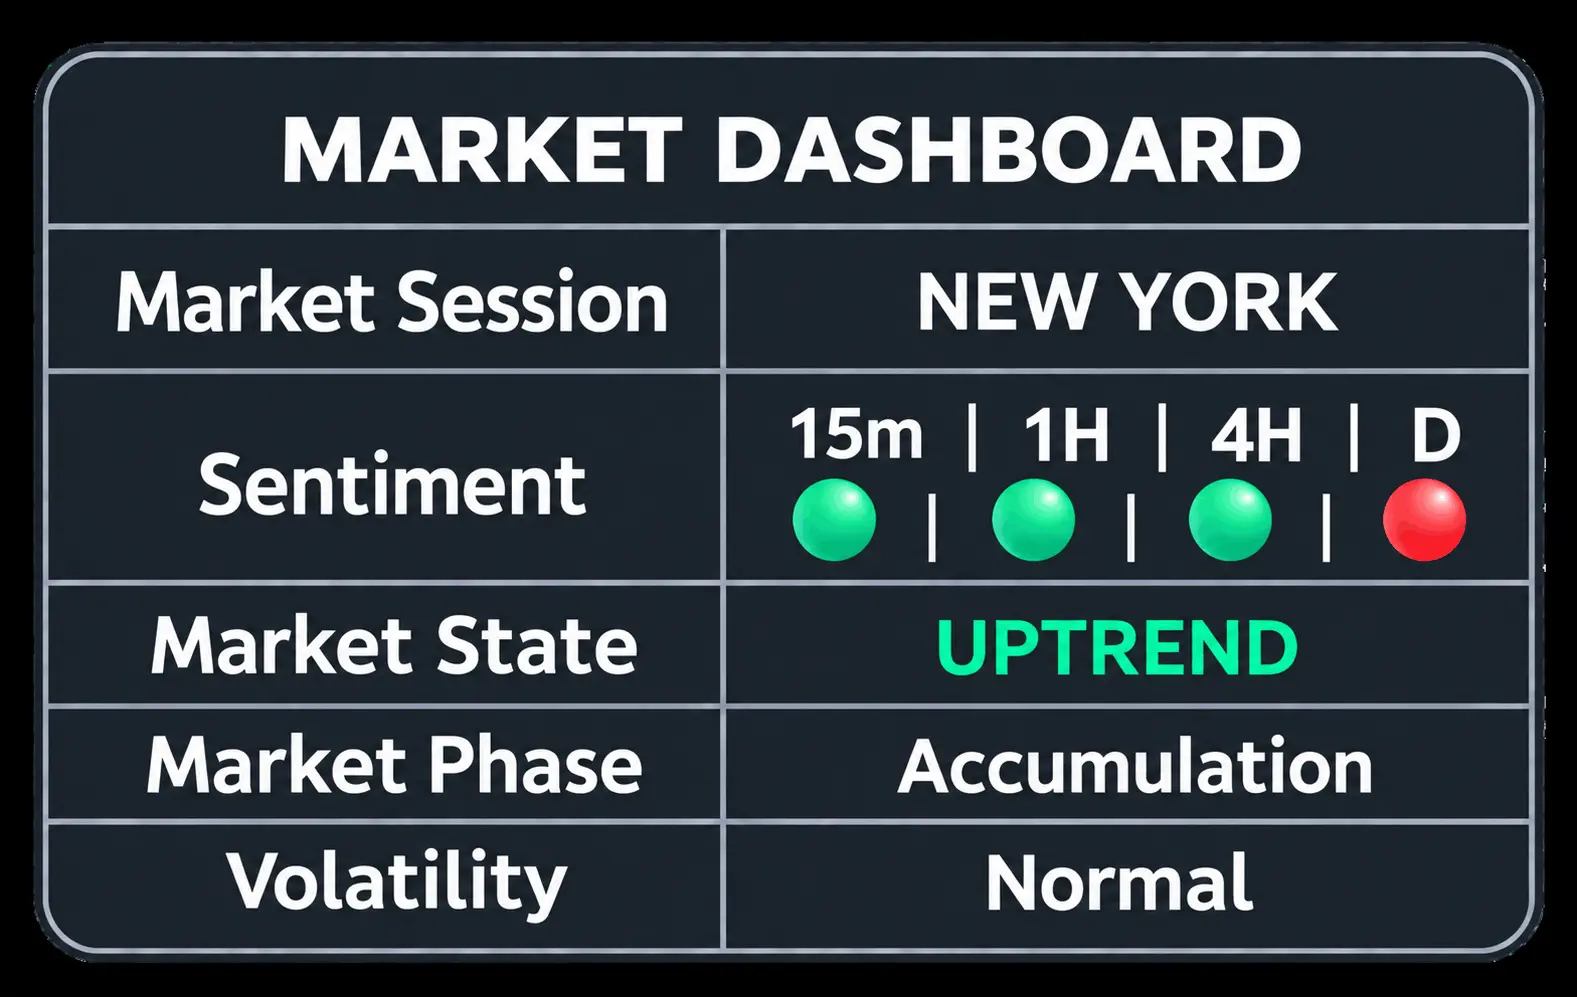
The dashboard gives you a quick view of the current market environment. Look at the dashboard variables first before focusing on any localized candle setups:

Live Session

Shows the active trading hours, such as Asian Range, London Open, New York, or London / NY Overlap.

Sentiment

Aggregates trend directions across time horizons including the 15m, 1H, 4H, and Daily charts.

Market State

Reads the localized trend structure, defining it clearly as Uptrend, Downtrend, or Consolidation.

Market Phase

Defines the macro market conditions, showing whether price is inside Accumulation, Distribution, or Balanced phases.

Trend Strength

Calculates real-time momentum levels to classify the trend speed as Strong, Developing, Weak, or Choppy.

Setup

Provides a guide legend for visual chart signals: ● Forming | ▲/▼ Developed.

Dashboard Overview Layout
Step 5

Understanding Main Markers

TST Nexus maps clean geometric shape indicators onto your active price chart to help you track setups dynamically:

Circle = Forming Setup

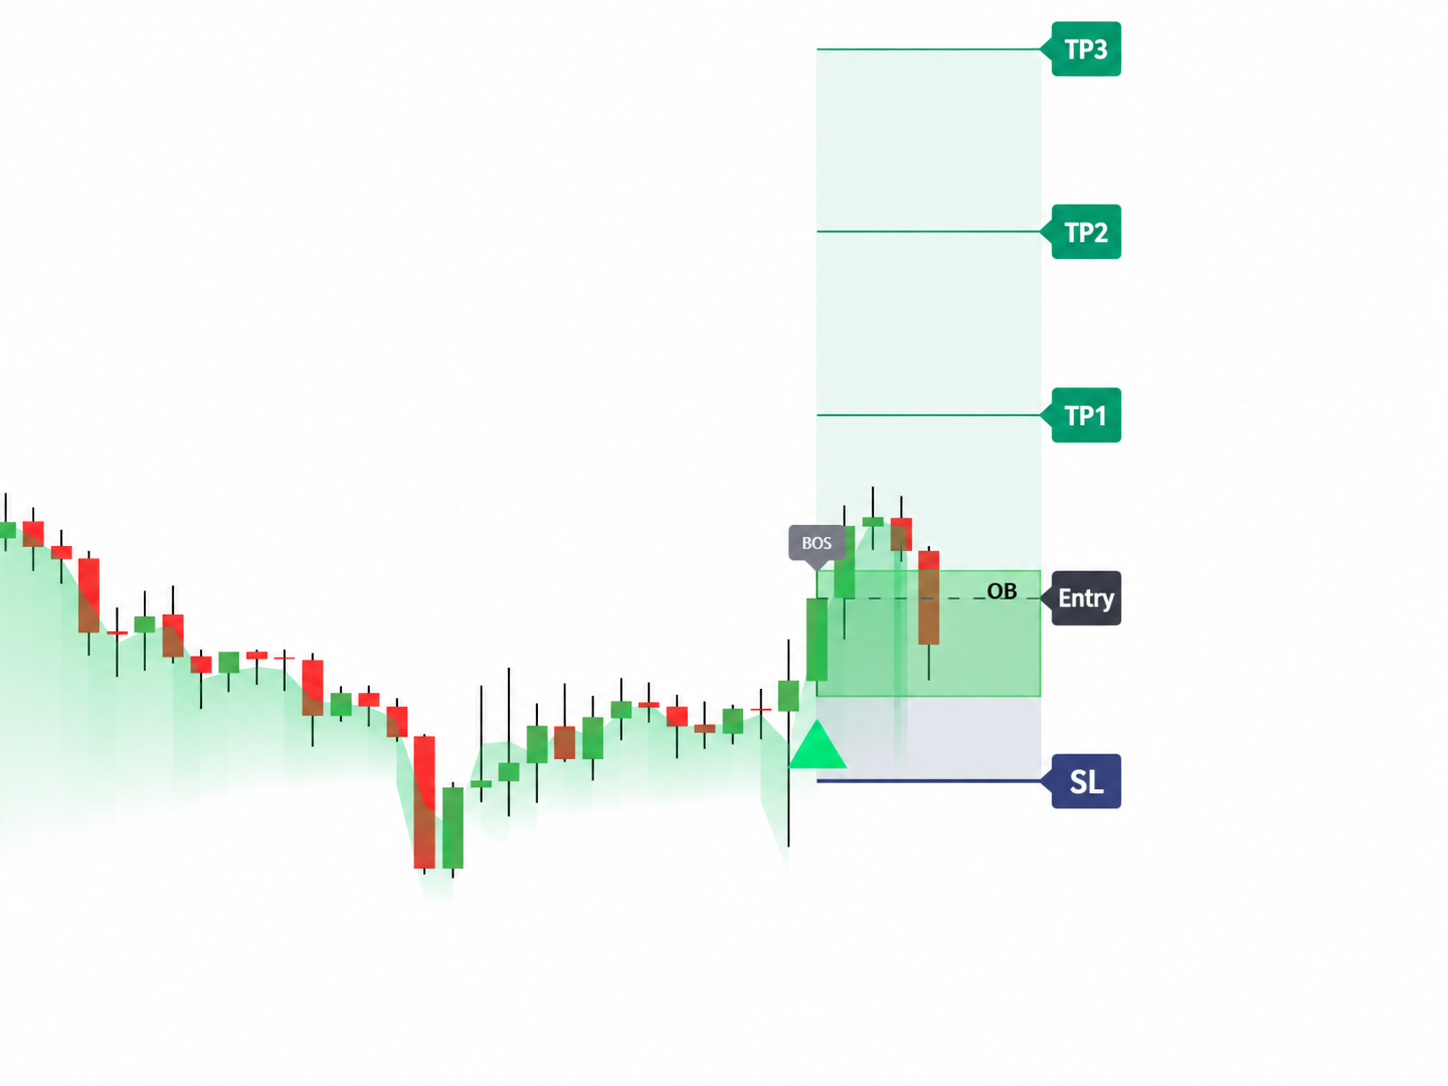
A circle signifies that a potential structure model is beginning to build. It serves as an early visual alert telling you to monitor the chart closely. **It is not an immediate trade entry signal.**

Triangle = Developed Setup

A triangle means the configuration has completed setup maturation rules. While representing a much stronger bias confirmation, triangles should still be filtered through structural context, dashboard metrics, and personal risk parameters.

Shapes Plotted on Price Action
Green Below Price = Bullish Context
Red Above Price = Bearish Context
Step 6

How to Use TST Nexus Workflow

The ultimate goal of TST Nexus is to teach you **how to think**, not just what to click. Avoid taking entries blindly based on a single marker. Always verify with our 7-step workflow:

1

Check the Dashboard First

Before studying specific candles, analyze the macro health overlay. Is the current session liquid enough to trade? What is the overall volatility?

Dashboard Analysis Step
2

Read Market State and Sentiment

Ensure alignment. When Market State (e.g., Uptrend) matches the Sentiment across your key time horizons, chart setups are significantly cleaner.

3

Watch for the Circle Marker

The circle is an early warning system showing a setup is forming. Mark out the price levels and prepare your directional thesis.

Forming Setup Warning
4

Wait for the Triangle Marker

Be patient and wait for confirmation. A forming setup (circle) is not valid until it transforms into a developed setup (triangle).

Developed Triangle Confirmation
5

Use OB, FVG, and Structure as Context

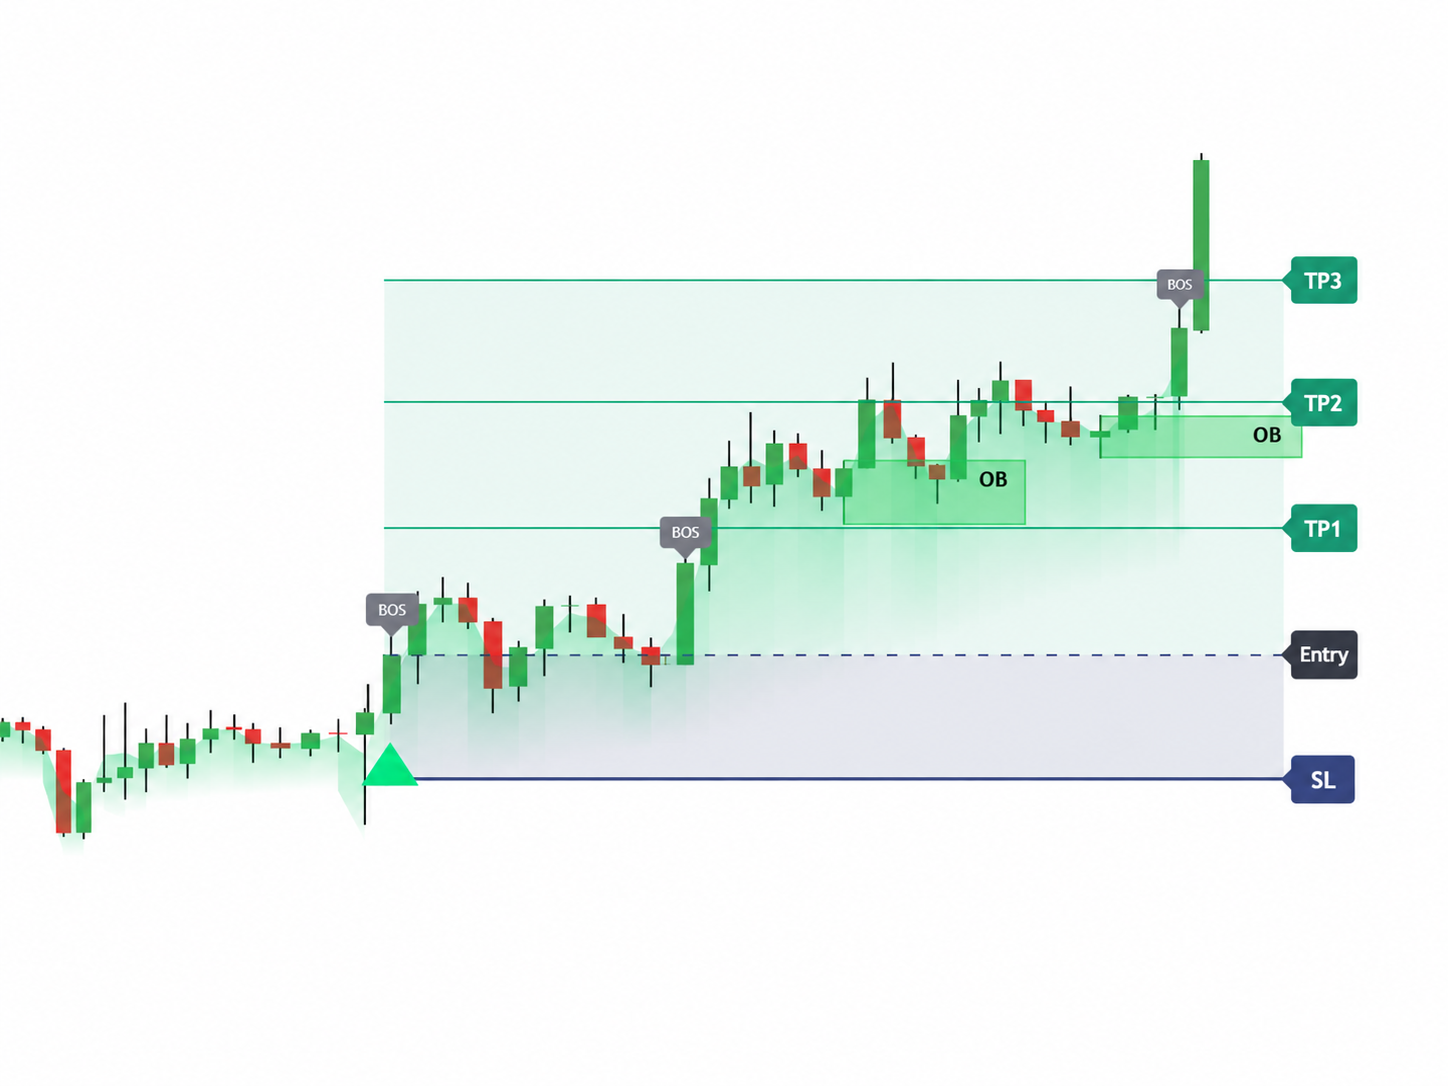
Review nearby chart levels. Is the triangle printing inside a structural Order Block, or is it working to fill a Fair Value Gap imbalance area?

Confluence Zones Structure Mapping
6

Never Use One Marker Alone

A single marker is never enough. Always cross-reference the markers with dashboard readings and key support/resistance boundaries.

7

Apply Your Own Risk Parameters

Define entry parameters, locate stop-loss invalidation thresholds, track relative target pools, and size positions correctly.

Training Scenario References

Example 1: Clean Example

Clean alignment screenshot

How to identify when daily trends, sentiment scales, and localized signals line up cleanly.

Example 2: Choppy Example

Choppy market screenshot

Unfavorable chart situations. Note how the dashboard flags weak volatility to warn traders against force entries.

Simple Rule to Remember

Main confluence overview map

Confluence summary: Circle (Forming), Triangle (Developed), Dashboard (Context), and Risk Plan (User Action).

Step 7

Optional Chart Tools

TST Nexus includes additional structural market tools that can be customized on/off inside settings depending on your active display mode:

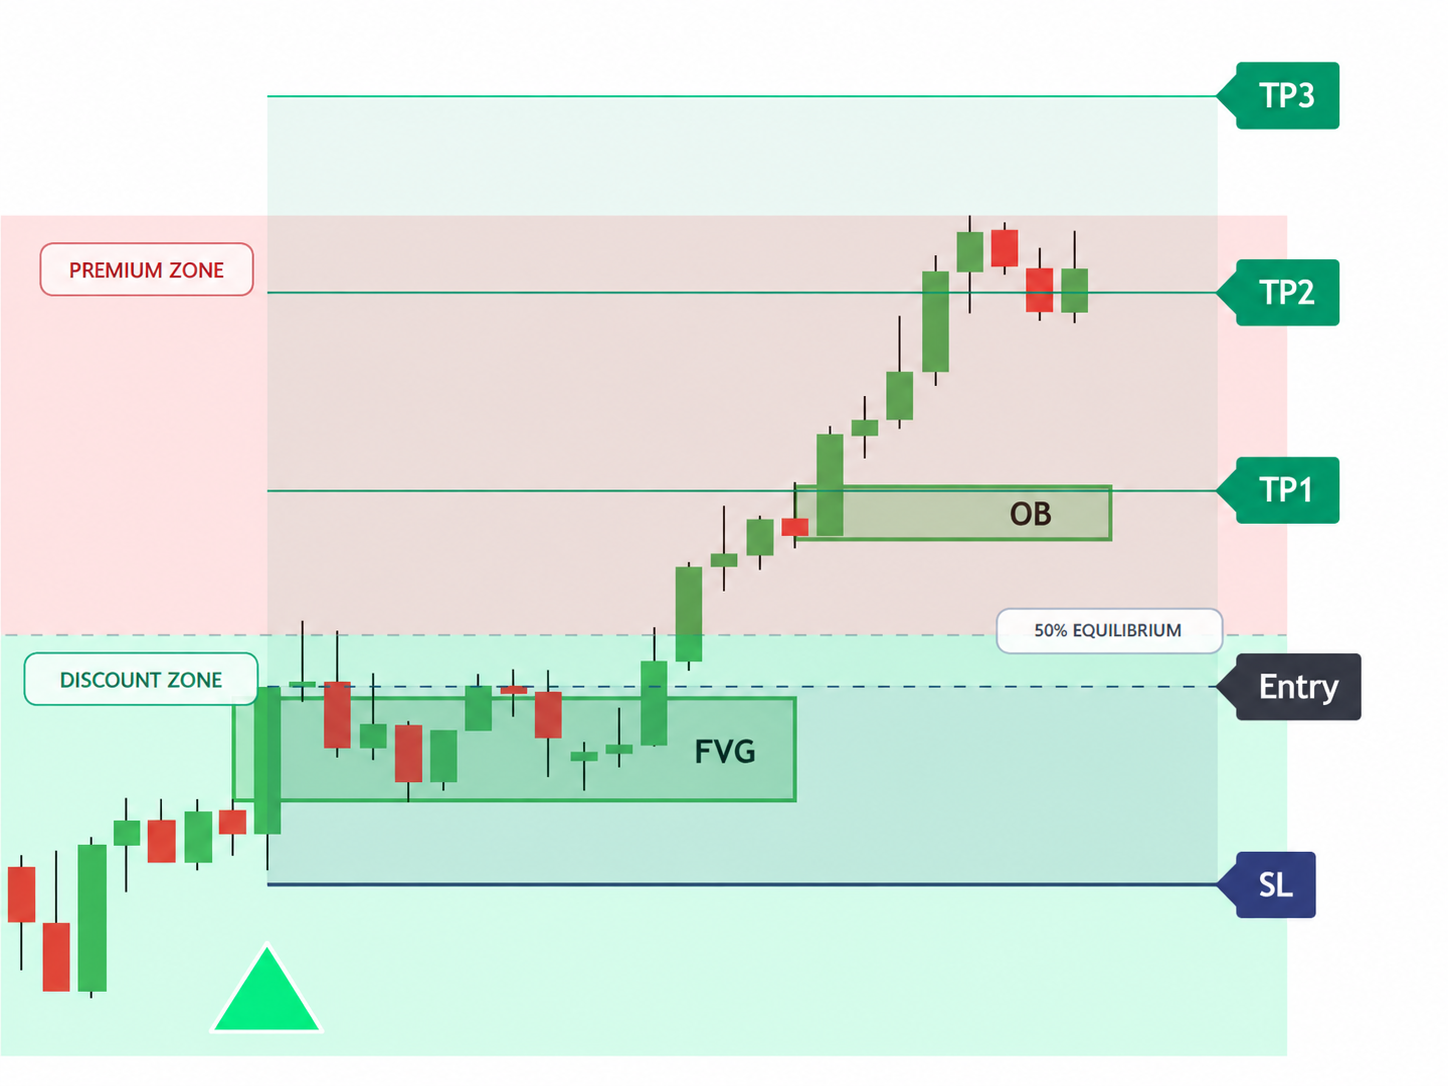
Fair Value Gaps / FVG

Highlights possible imbalance areas on the chart where price action filled too quickly.

Order Blocks / OB

Shows potential price zones where high-volume institutional accumulation occurred.

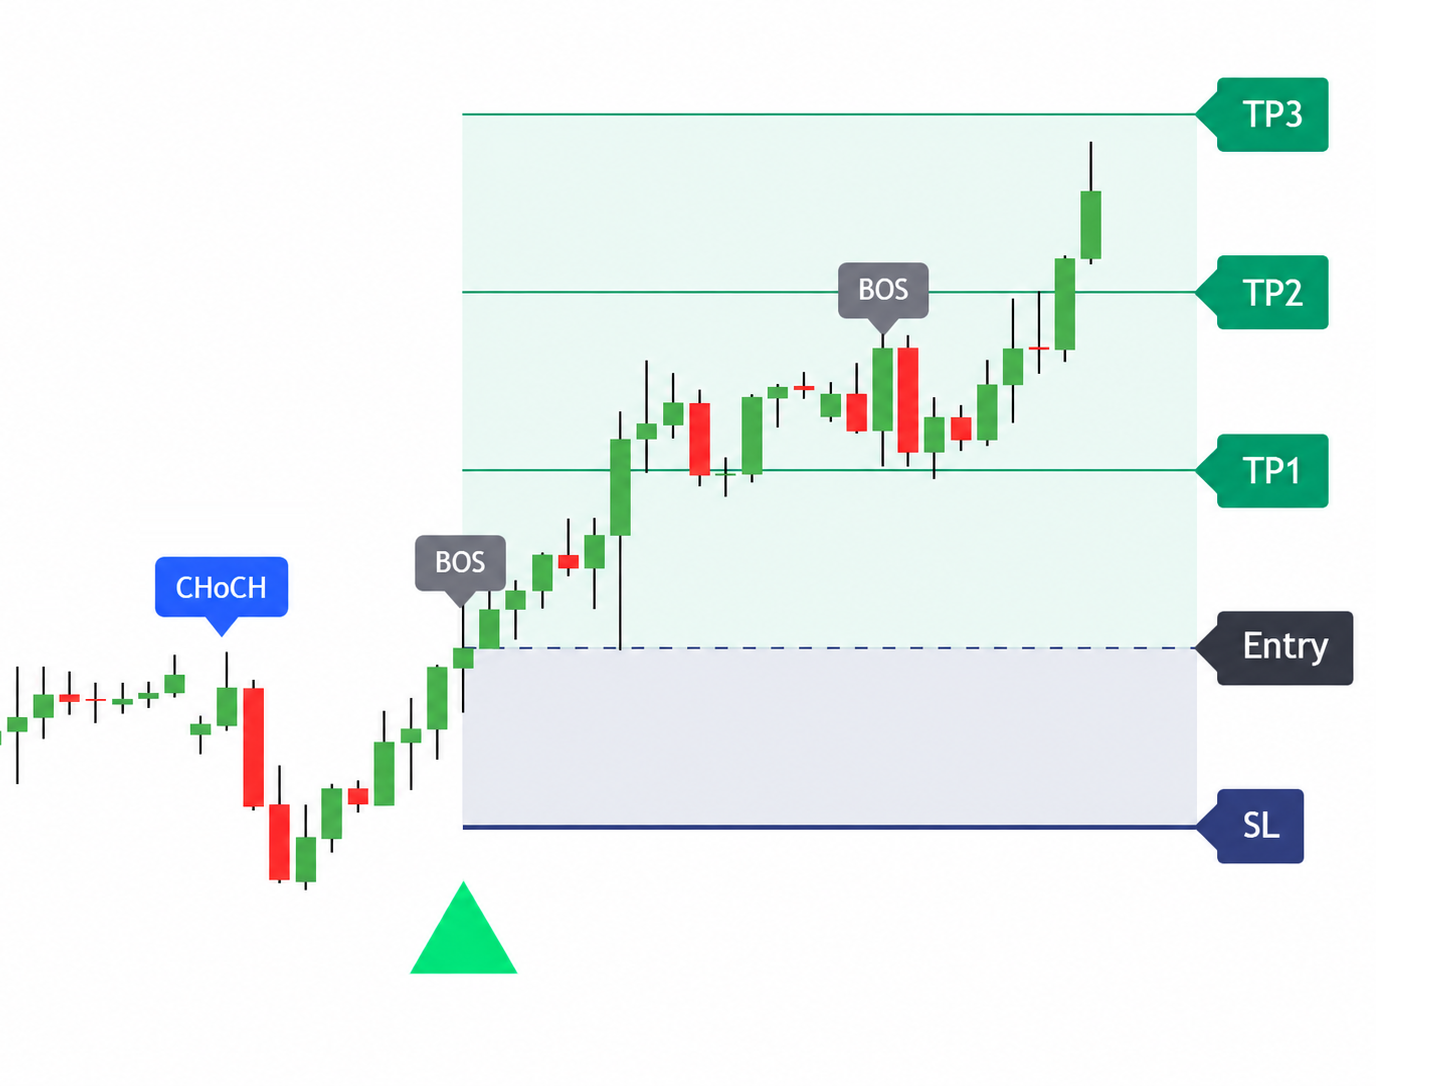
Break of Structure / BOS

Traces trend extensions by signaling whenever price structural highs or lows are formally broken.

Change of Character / CHoCH

Traces early visual structure shifts, providing helpful feedback on potential trend reversals.

Premium / Discount Zones

Instantly identifies whether price is trading in premium (expensive) or discount (cheap) zones of the range.

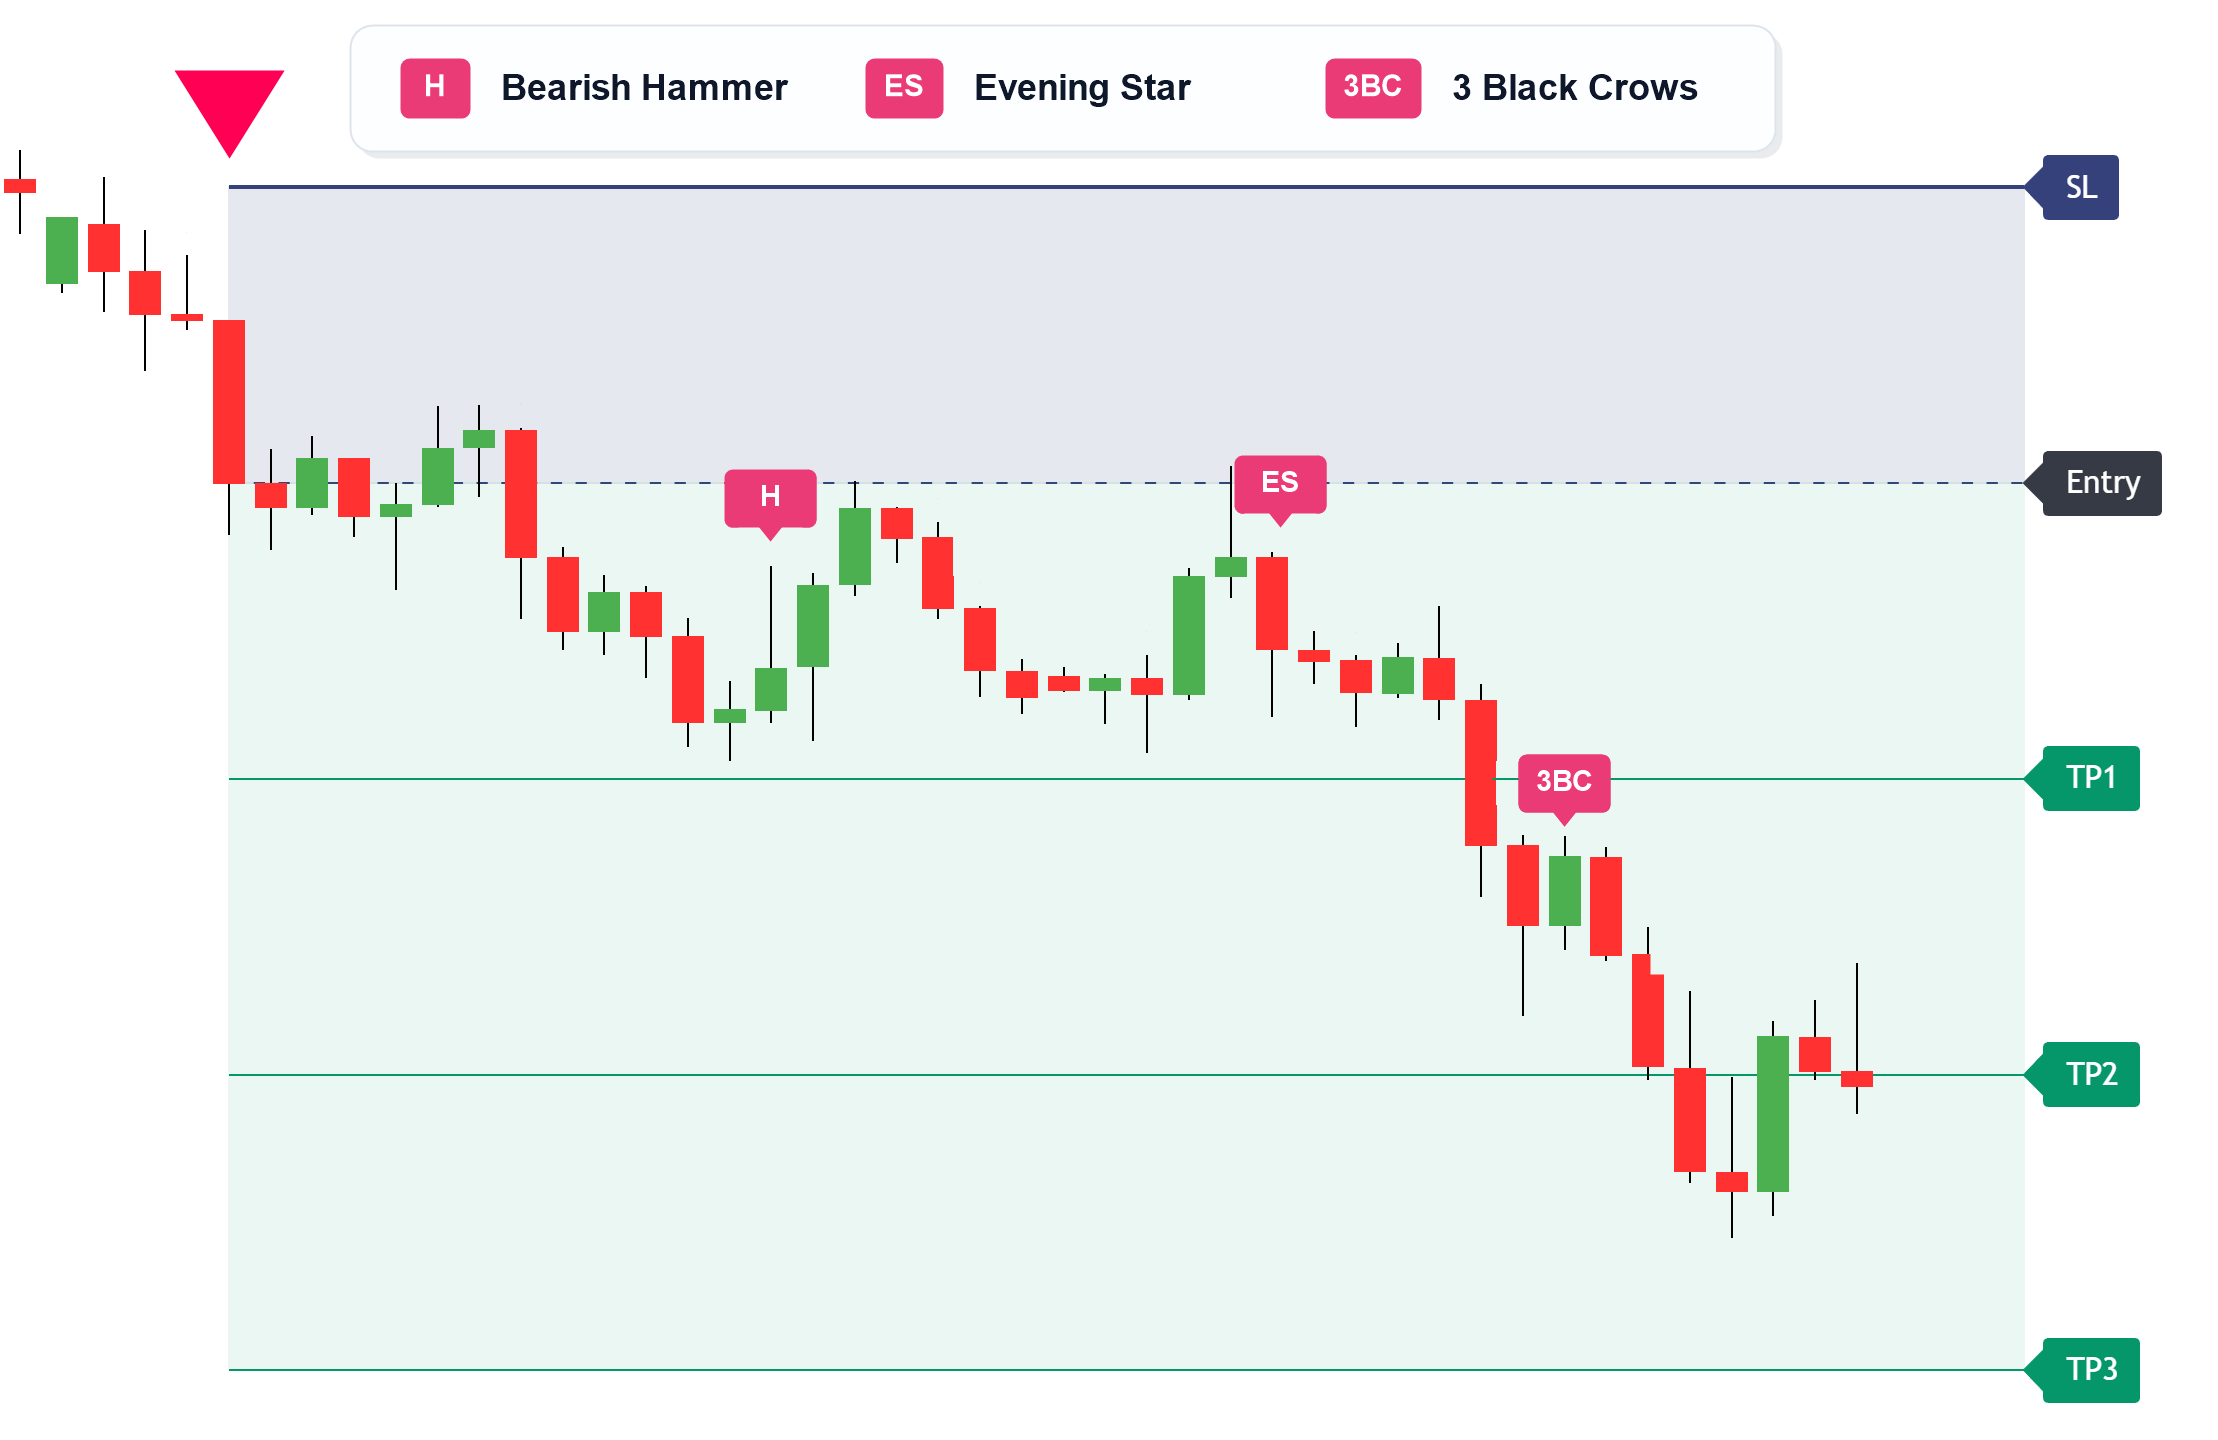
Candlestick Engine

Allows you to display selected candlestick patterns, such as engulfing candles, hammers, morning stars, evening stars, three white soldiers, and three black crows.

Step 8

Alerts

TST Nexus allows you to create TradingView alerts for key marker events. Configure automated alerts so you never miss a setup development while away from your screen:

Circle Marker Alerts Triggers immediately on circle occurrence to help you prepare structural charts.
Triangle Marker Alerts Triggers as soon as confirmation structures mature on absolute bar close.
Important: Alerts are only notifications. They are not automatic trade instructions. Always check the chart before making any decision.
Step 9

FAQ + Risk

Is TST Nexus a signal service?
No. TST Nexus is not a signal service. It is a visual charting tool designed to help you read market context, identify developing setups, and organize your technical analysis. You are responsible for your own decisions.
Is this financial advice?
No. TST Nexus is not financial advice. The indicator is for educational and analytical purposes only. It should not be treated as a recommendation to buy, sell, enter, or exit any trade.
Does the indicator guarantee profitable trades?
No. No indicator can guarantee profitable trades. Trading involves risk, and losses are always possible. TST Nexus helps you read the chart, but it does not remove risk or replace your trading plan.
What does the circle mean?
The circle means a setup is **forming**. It is an early visual marker that tells you to pay attention to the chart. It does not mean you should enter a trade immediately.
What does the triangle mean?
The triangle means a setup has **developed**. It is a stronger visual marker than the circle, but it should still be reviewed with the dashboard, market structure, sentiment, and your own risk plan.
Why did I get a circle but no triangle?
A circle can appear when a setup is still forming. A triangle may not appear if the setup does not continue developing. This is normal. Not every forming setup becomes a developed setup.
Why are some setups stronger than others?
Some setups appear in cleaner market conditions than others. For example, a setup may look stronger when market state, sentiment, trend strength, and structure are more aligned. A setup may look weaker when the market is choppy, mixed, or unclear.
What is Beginner Mode & Pro Mode?
Beginner Mode: Keeps your chart simple. Focus on Live Session, Sentiment, Setup markers, and simple circle/triangle development. Best for users who want less distractions.

Pro Mode: Gives deeper context. Focus on Market State, Market Phase, Trend Strength, BOS, CHoCH, FVG, OB, and Premium/Discount Zones. Best for deeper technical screening.
What markets and timeframes can it be used on?
TST Nexus is highly optimized to run across all asset indexes offered inside TradingView including Forex, Cryptocurrencies, Stocks, major Indices, and Commodities. It calculates across multiple timeframes. Pick the timeframes that match your trading style and review the dashboard and chart context together.
Why do I see fewer signals in Conservative Mode?
If fewer markers appear, it usually means the chart is showing fewer developed conditions. This can happen during slow, sideways, or unclear markets. Conservative or stricter signal modes are programmed to skip lower-probability ranges.
Why does the chart look crowded? How do I hide OB/FVG/BOS/CHoCH?
The chart may look crowded if too many tools are enabled at the same time. Open your TradingView indicator settings panel. Go to the tab labeled SMC & Market Structure to deselect or customize blocks (BOS, CHoCH, FVG, OB, or Premium/Discount). Start simple and add tools only when needed.

Important Risk Reminder

TST Nexus is an educational charting tool. It is not financial advice, not a signal service, and not a guaranteed profit system. Always use your own risk management and trade plan. Trading involves risk; only risk what you can afford to lose.

Step 10

Troubleshooting

What should I do if the indicator does not show on my chart? Follow these structural validation steps:

  • Make sure your TradingView username is connected inside Whop.
  • Make sure your Whop purchase is active.
  • Make sure you are logged into the correct TradingView account.
  • Go to TradingView → Indicators → Purchased / Invite-only Scripts.
  • Select TST Nexus and add it to the chart.

Why can’t I see TST Nexus under indicators? This usually happens when the wrong TradingView username is connected, or access has not synced yet. Check your Whop account and make sure your TradingView username is correct. If the issue continues, contact us through Whop Chat or email support.

Support Desk

If you need help accessing or using TST Nexus, contact us through our dedicated support channels below: