TST Nexus Indicator Toolkit
Welcome to the official documentation and reference guide for the TST Nexus TradingView indicator. Learn how to connect your account, configure display modes, interpret Entry, SL, and TP1–TP3 price levels, monitor the performance dashboard, and set up automated alerts.
Getting Access
Link your exact TradingView username inside Whop to receive invite-only script access.
Prices & Manual Trades
Understand rule-based Entry, SL, and TP1–TP3 targets for your manual trade execution.
Performance Dashboard
Read on-chart metrics, including Total Trades, Win Rate, Net Return, and Drawdown.
Get Access to TST Nexus
Access to TST Nexus is managed through Whop and provisioned directly to your personal TradingView profile. Follow these short steps to activate your script access:
- Sign up or log in to Whop: Ensure your active TST Nexus membership is linked to your Whop account.
- Connect your exact TradingView username: Navigate to your member settings in Whop and enter your exact TradingView username.
- Wait for automatic provisioning: Once submitted, script permissions sync automatically to your TradingView account within a few minutes.
Add or Remove the Indicator
Once your username has been provisioned, you can add TST Nexus to any asset chart on the TradingView desktop app, web browser, or mobile app.
Adding to Your Chart
- Open your desired chart on TradingView.
- Click the Indicators button in the top toolbar (or press /).
- In the modal menu, select Invite-only scripts on the left.
- Click TST Nexus to add it onto your chart.
Removing from Your Chart
- Move your cursor over the chart legend at the top-left corner.
- Locate the TST Nexus indicator row.
- Click the X (Remove) icon to delete it from the chart.
- Alternatively, right-click anywhere on the indicator line and select Remove.
Quick Start
Follow these four steps to start using TST Nexus effectively on any instrument:
Choose a Chart & Timeframe
Select your preferred market (Forex, Crypto, Indices, Stocks, or Commodities) and timeframe (such as 5m, 15m, 1H, or 4H).
Add TST Nexus
Go to Indicators → Invite-only scripts and click TST Nexus to load it directly onto your active price chart.
Select Your Display Mode
Open the indicator settings and choose between Beginner, Balanced, or Pro mode based on your preference.
Follow Signals & Dashboard
Monitor Buy/Sell signals, review calculated Entry, SL, and TP1–TP3 levels, and confirm overall context on the performance dashboard.
Prices and Manual Trades
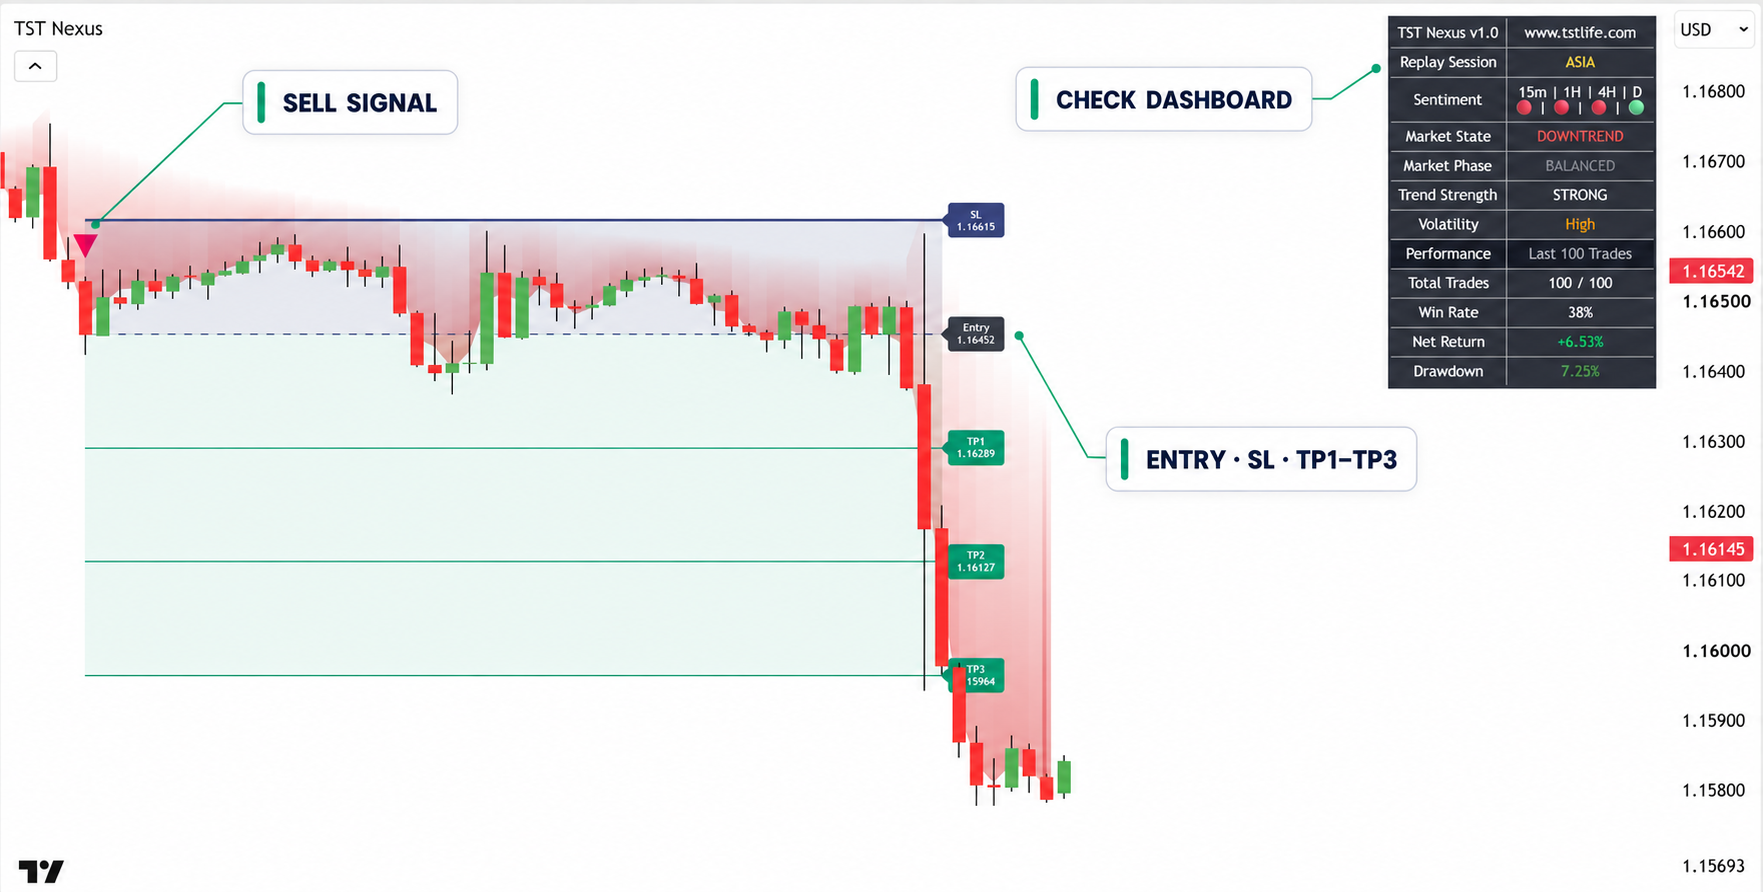
When a setup triggers, TST Nexus calculates rule-based price levels directly on your chart. These levels provide structured risk-to-reward boundaries for each trade setup.
Trigger Price
The exact reference price where the Buy or Sell setup criteria have been validated.
Stop Loss
The structural invalidation point. If price crosses this level, the trade setup thesis is invalidated.
Take Profit Targets
Progressive targets for partial profit taking: TP1 (conservative/secure), TP2 (structural target), and TP3 (extended trend runner).
Settings and Display
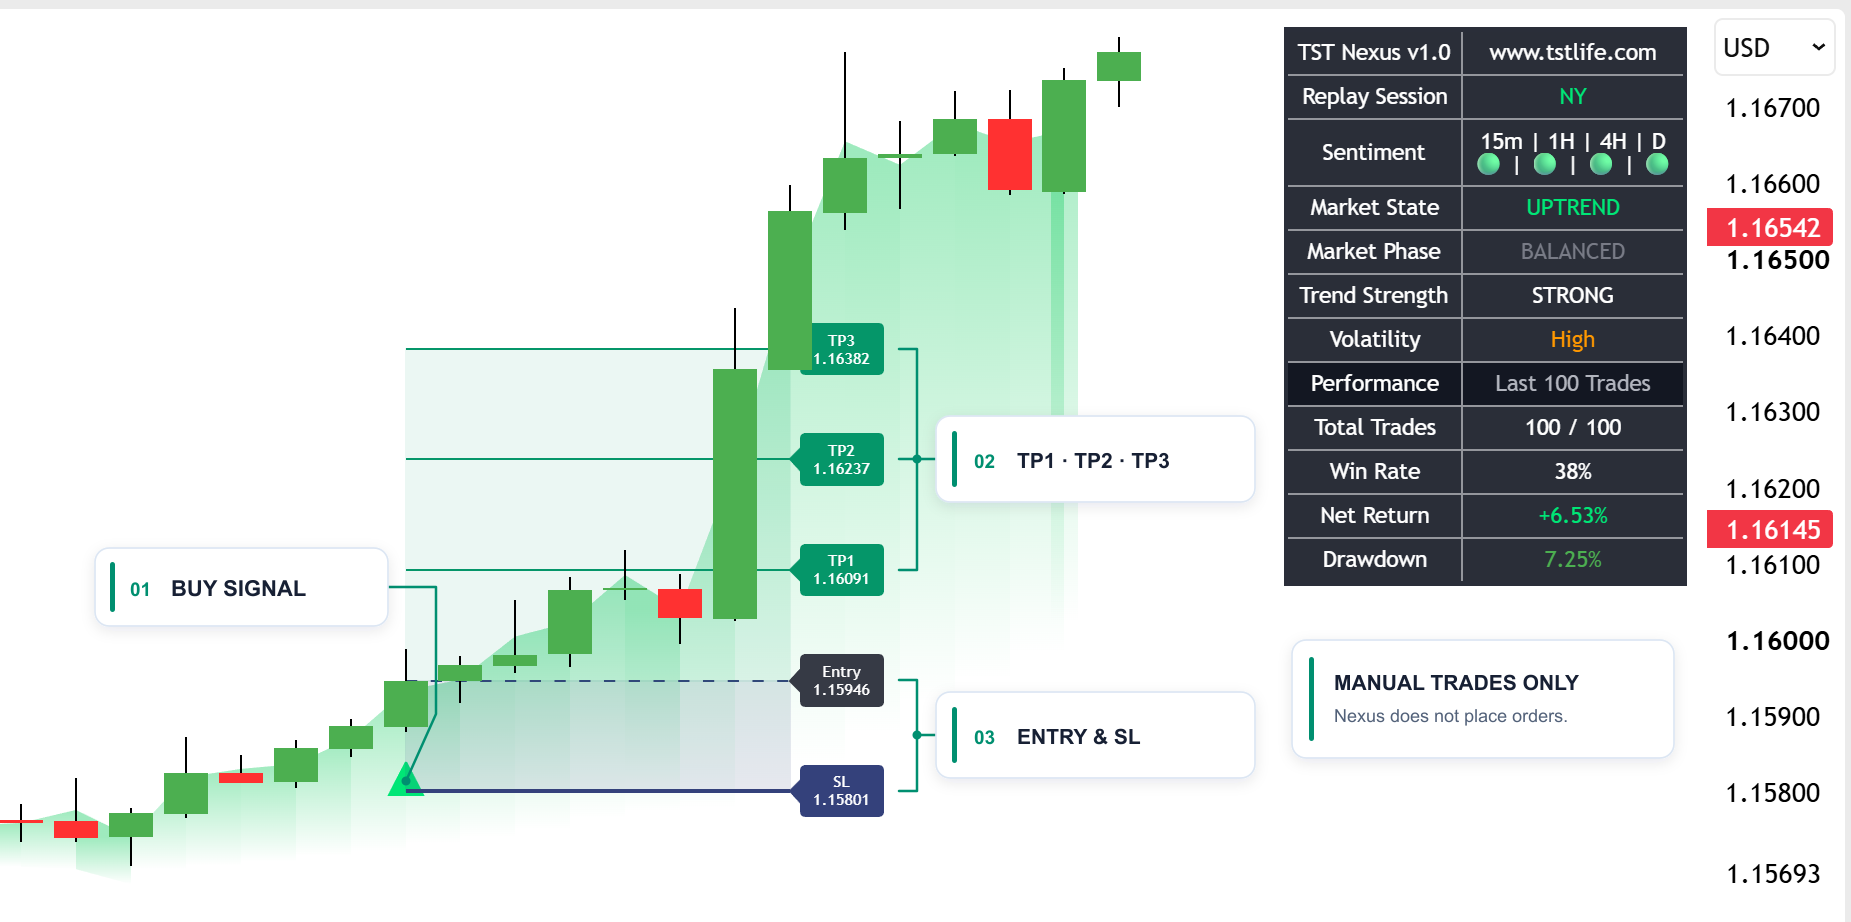
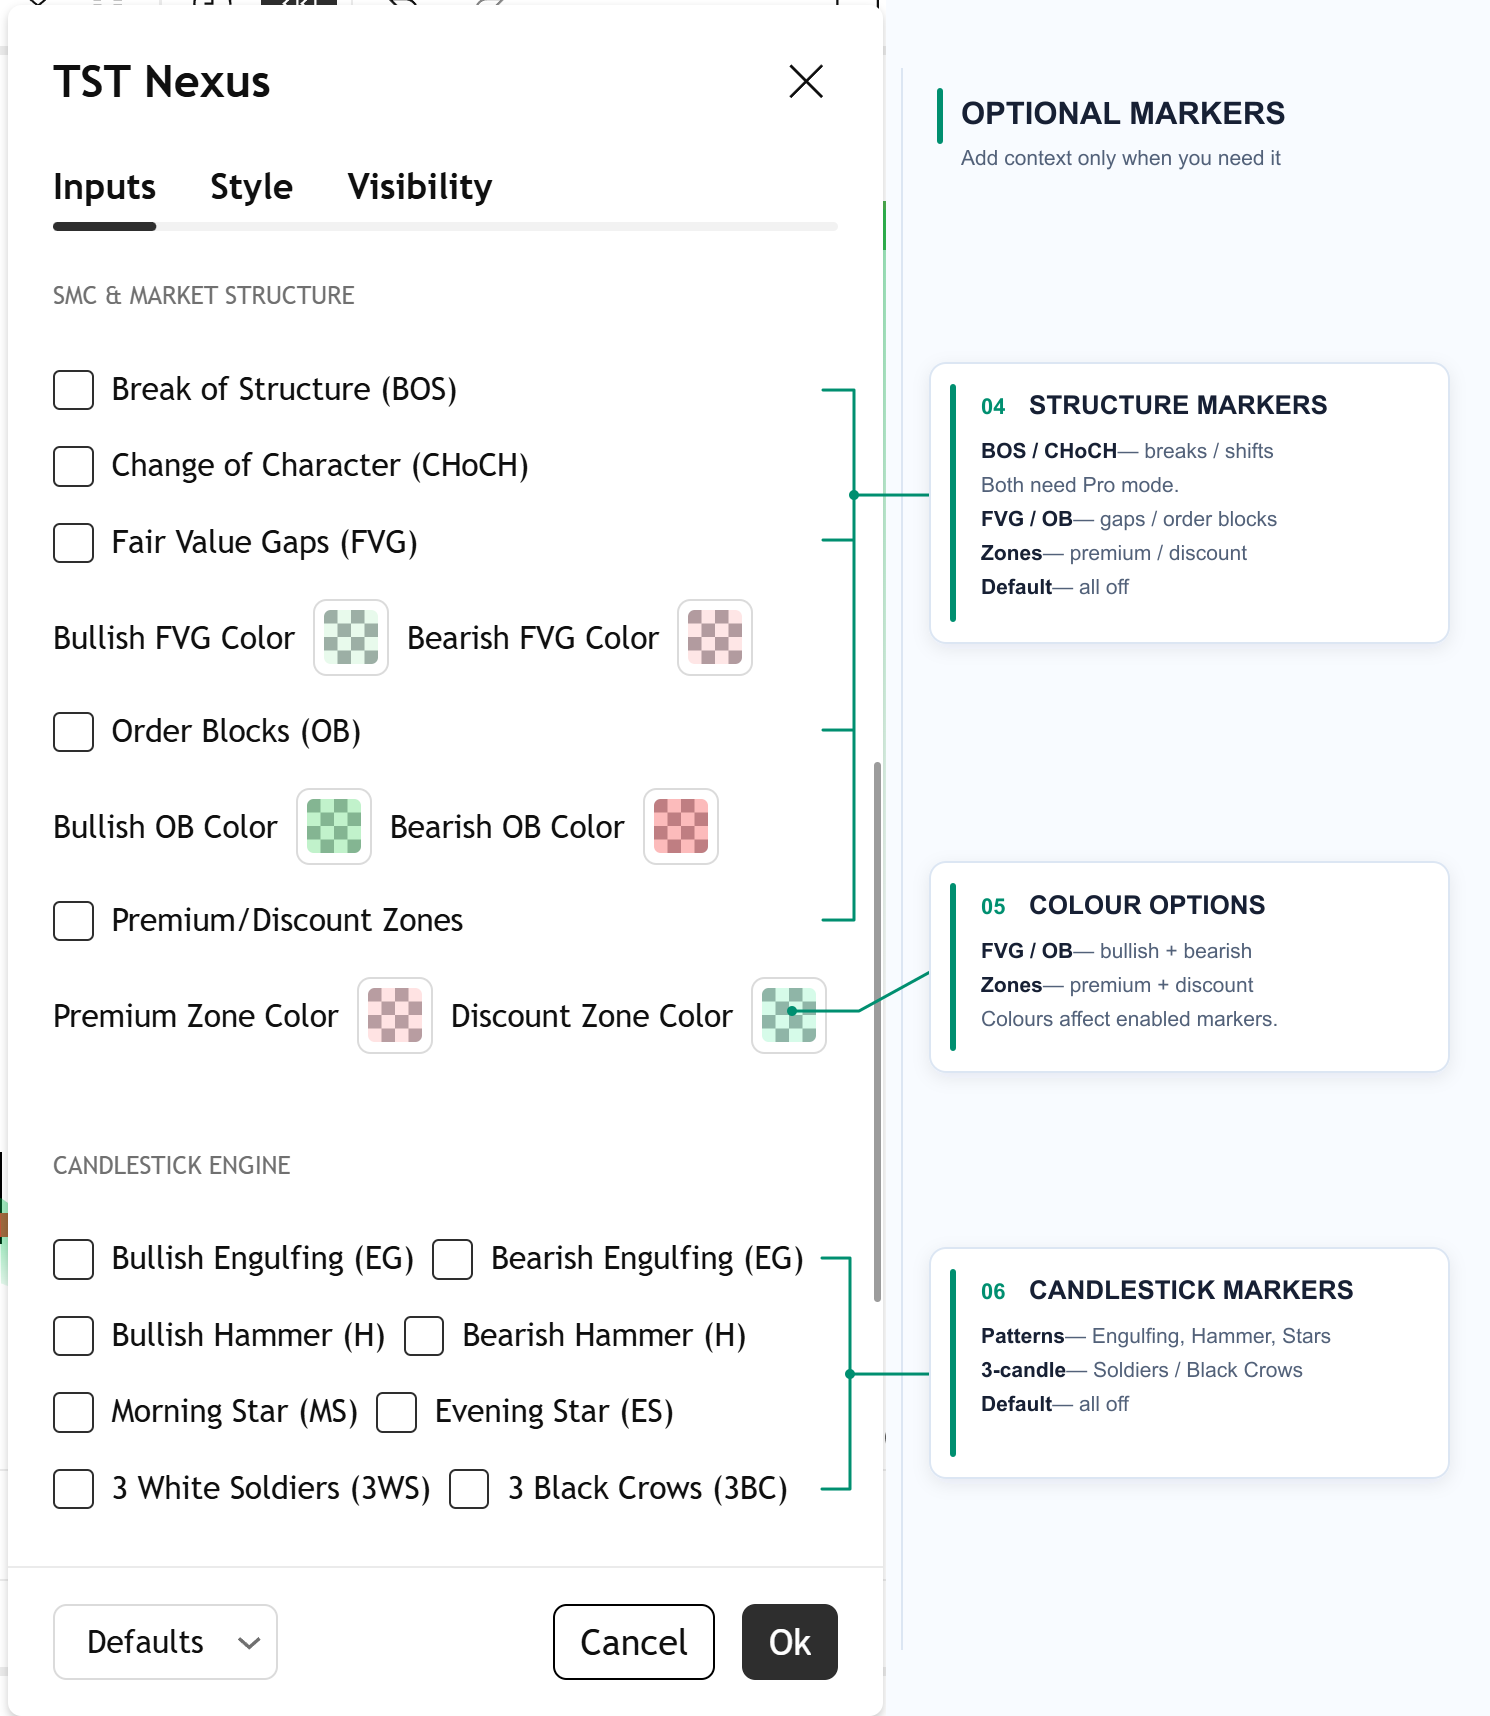
Access the indicator settings anytime by double-clicking the indicator name or clicking the gear icon in TradingView. Customize your display modes, signal filters, and layout:
| Setting | Options / Defaults | Description |
|---|---|---|
| Display Mode | Beginner | Balanced | Pro | Controls HUD complexity. Beginner keeps the chart clean; Pro displays deep structural metrics. |
| Signal Direction | Buy & Sell | Buy Only | Sell Only | Filter setups based on your macro directional bias or market condition. |
| Signal Sensitivity | Standard | Conservative | Aggressive | Adjust the confirmation threshold for generating Buy/Sell signals. |
| Price Levels | Entry, SL, TP1, TP2, TP3 toggles | Show or hide specific calculated price lines and labels on the active chart. |
| Dashboard Position | Top Right | Bottom Right | Top/Bottom Left | Move the performance dashboard overlay to prevent covering current price action. |
| Theme & Colors | Light | Dark | Custom | Adapt signal markers and dashboard colors to match your TradingView chart theme. |
Performance Dashboard
Reading the Dashboard
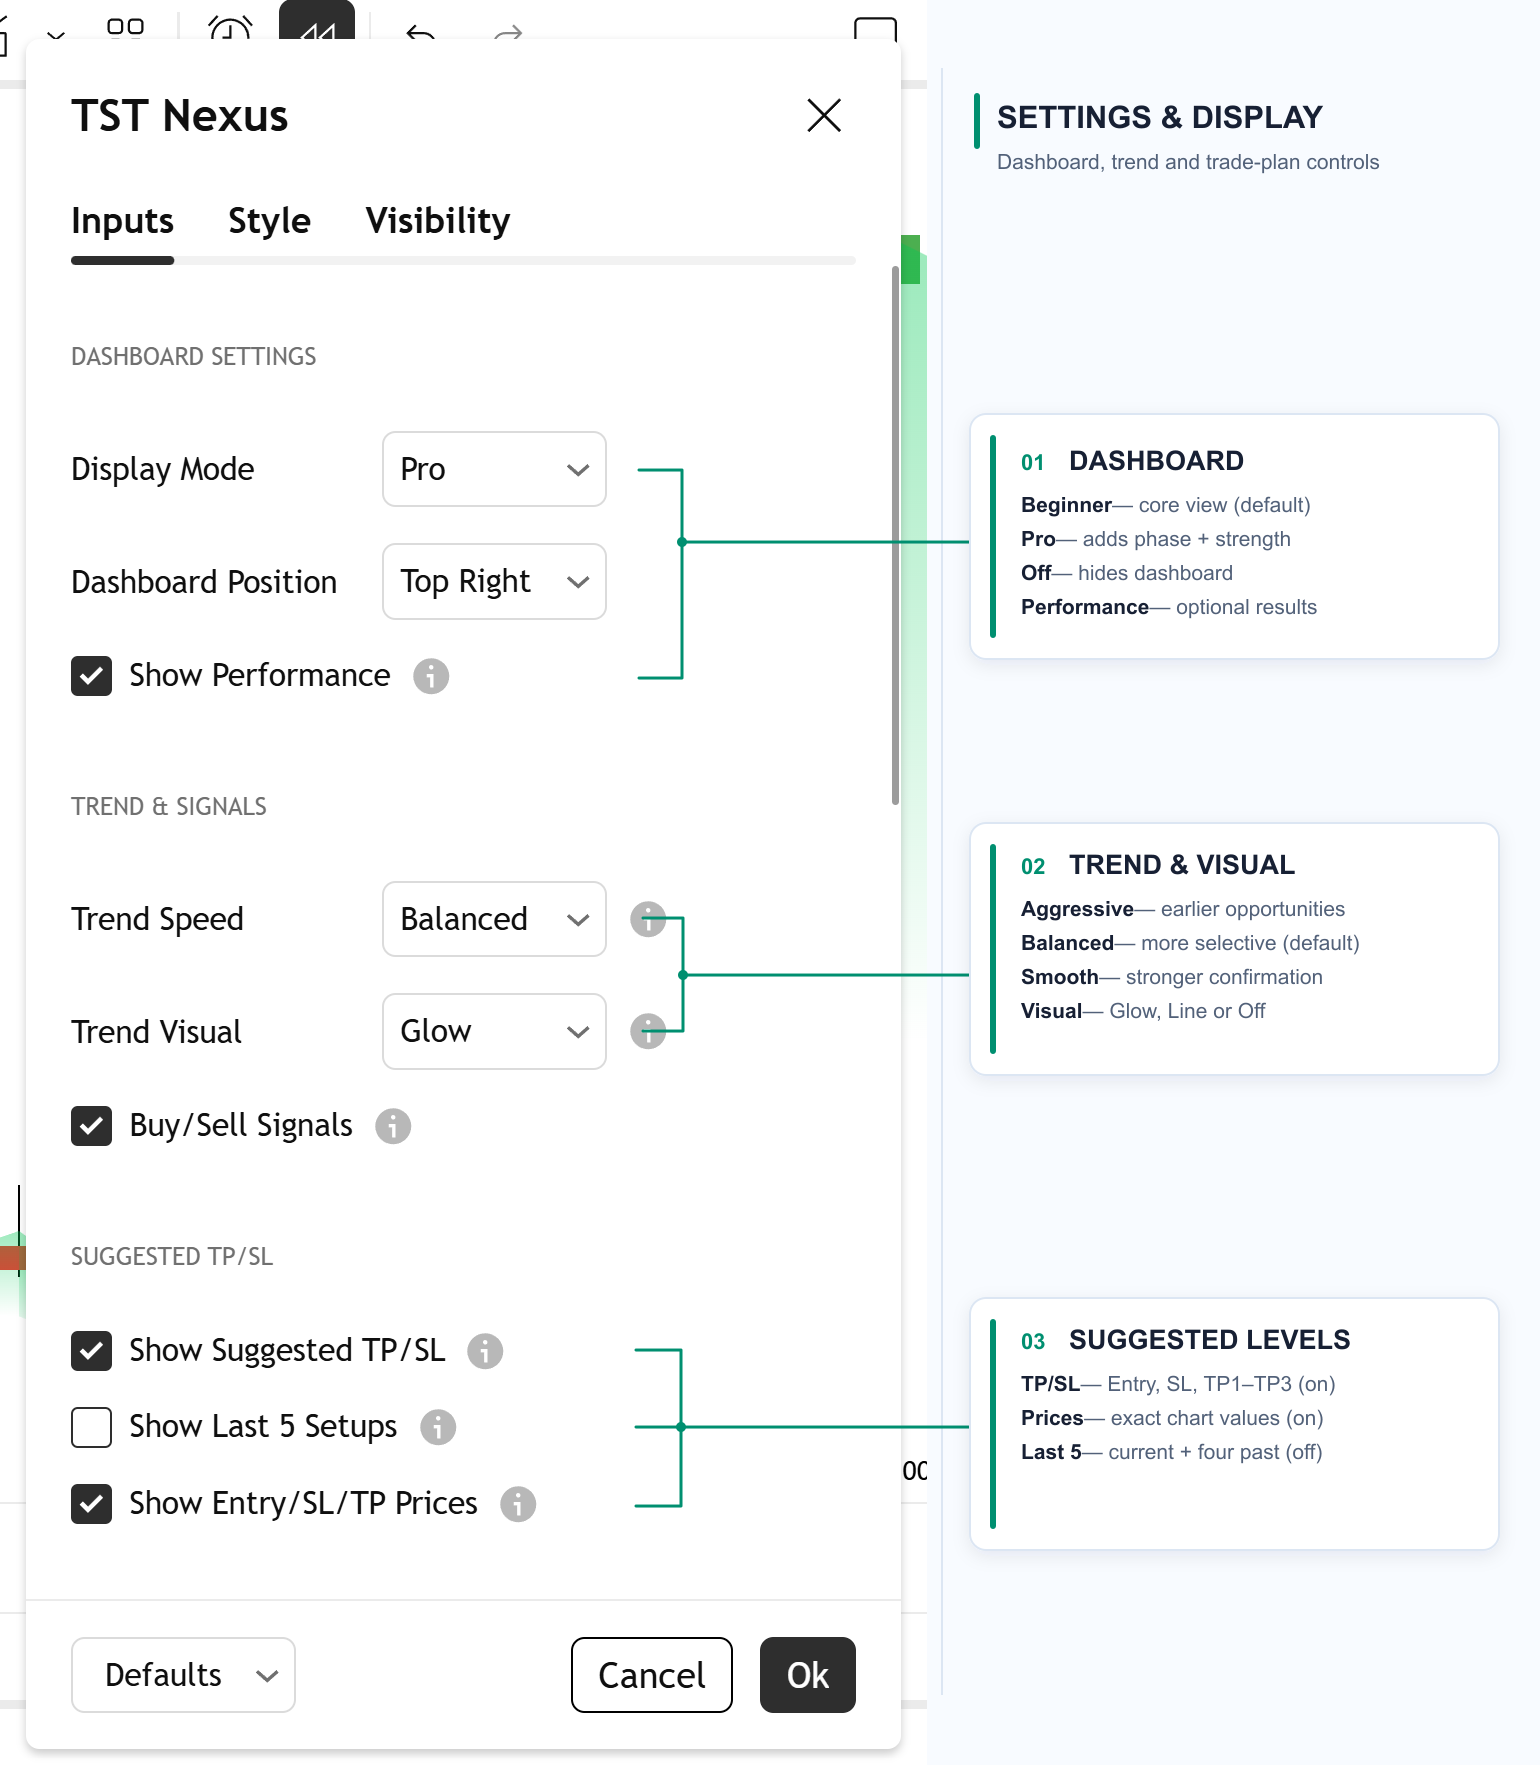
The performance dashboard overlays directly on your chart to give you immediate, high-level feedback on the instrument’s historical behavior and current setup state. It helps you assess market context at a glance without switching tabs or windows.
Performance Figures
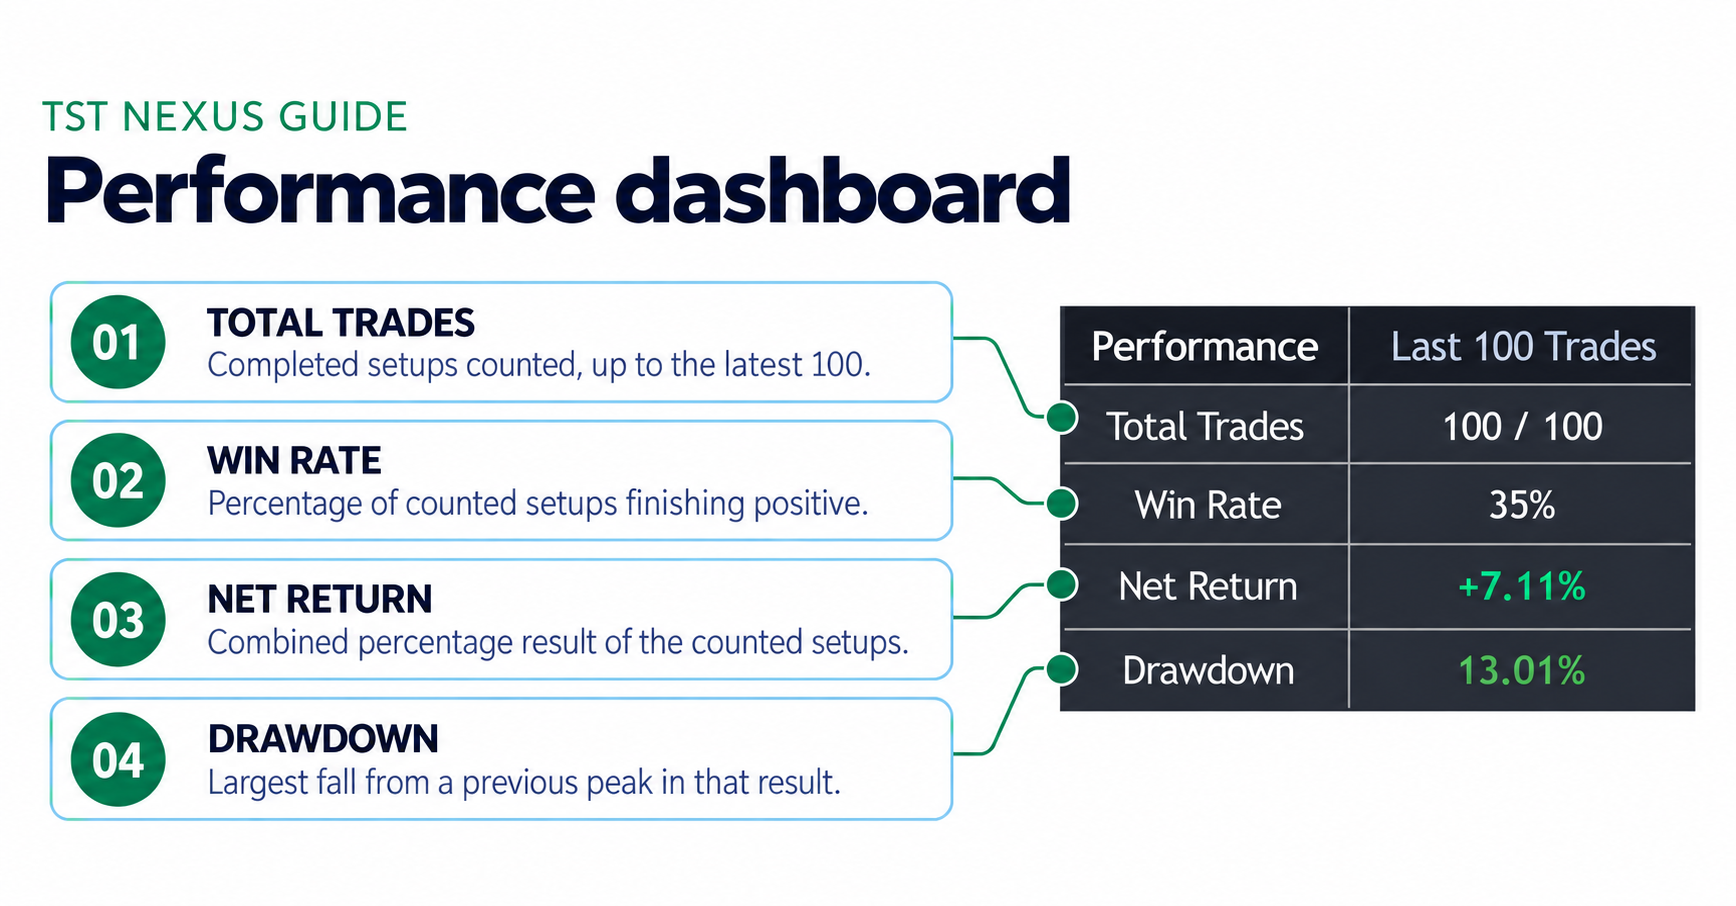
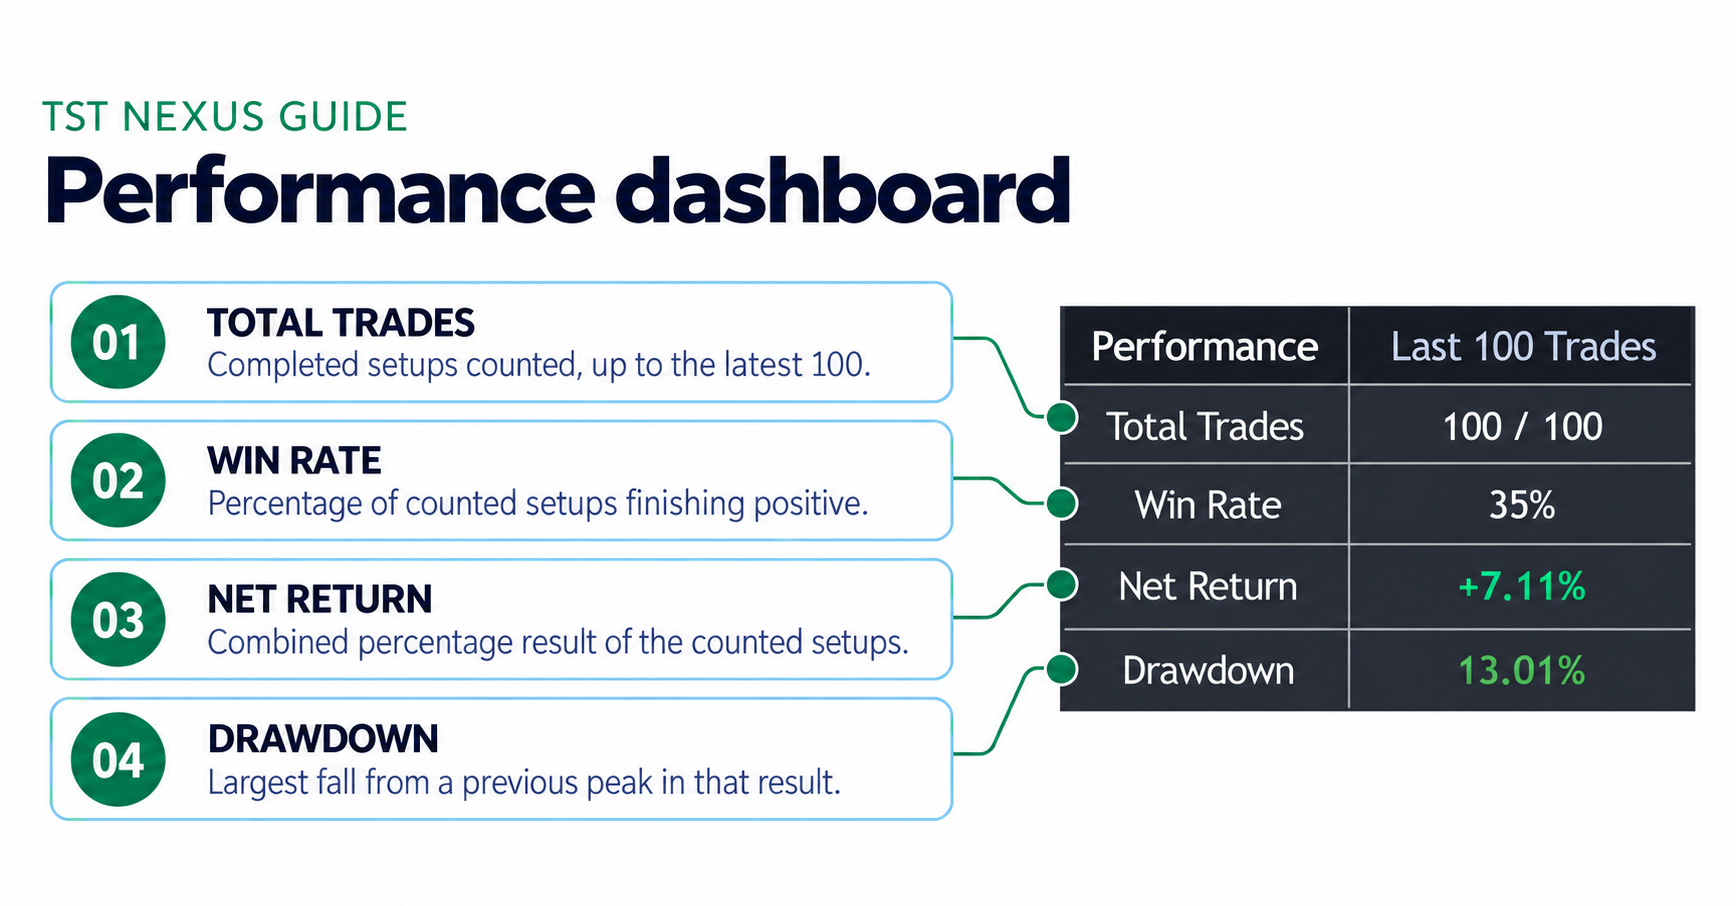
The lower section of the dashboard summarizes four key historical statistical metrics based on the current chart view and selected lookback period:
Total Trades
The total number of historical signal events calculated and tracked on the chart within the active sample range.
Win Rate
The percentage of recorded setups that reached at least Take Profit 1 (TP1) prior to reaching the Stop Loss level.
Net Return
The cumulative simulated return percentage calculated across the tested sample period.
Drawdown
The largest peak-to-trough decline observed in simulated equity during the backtested period.
Alerts
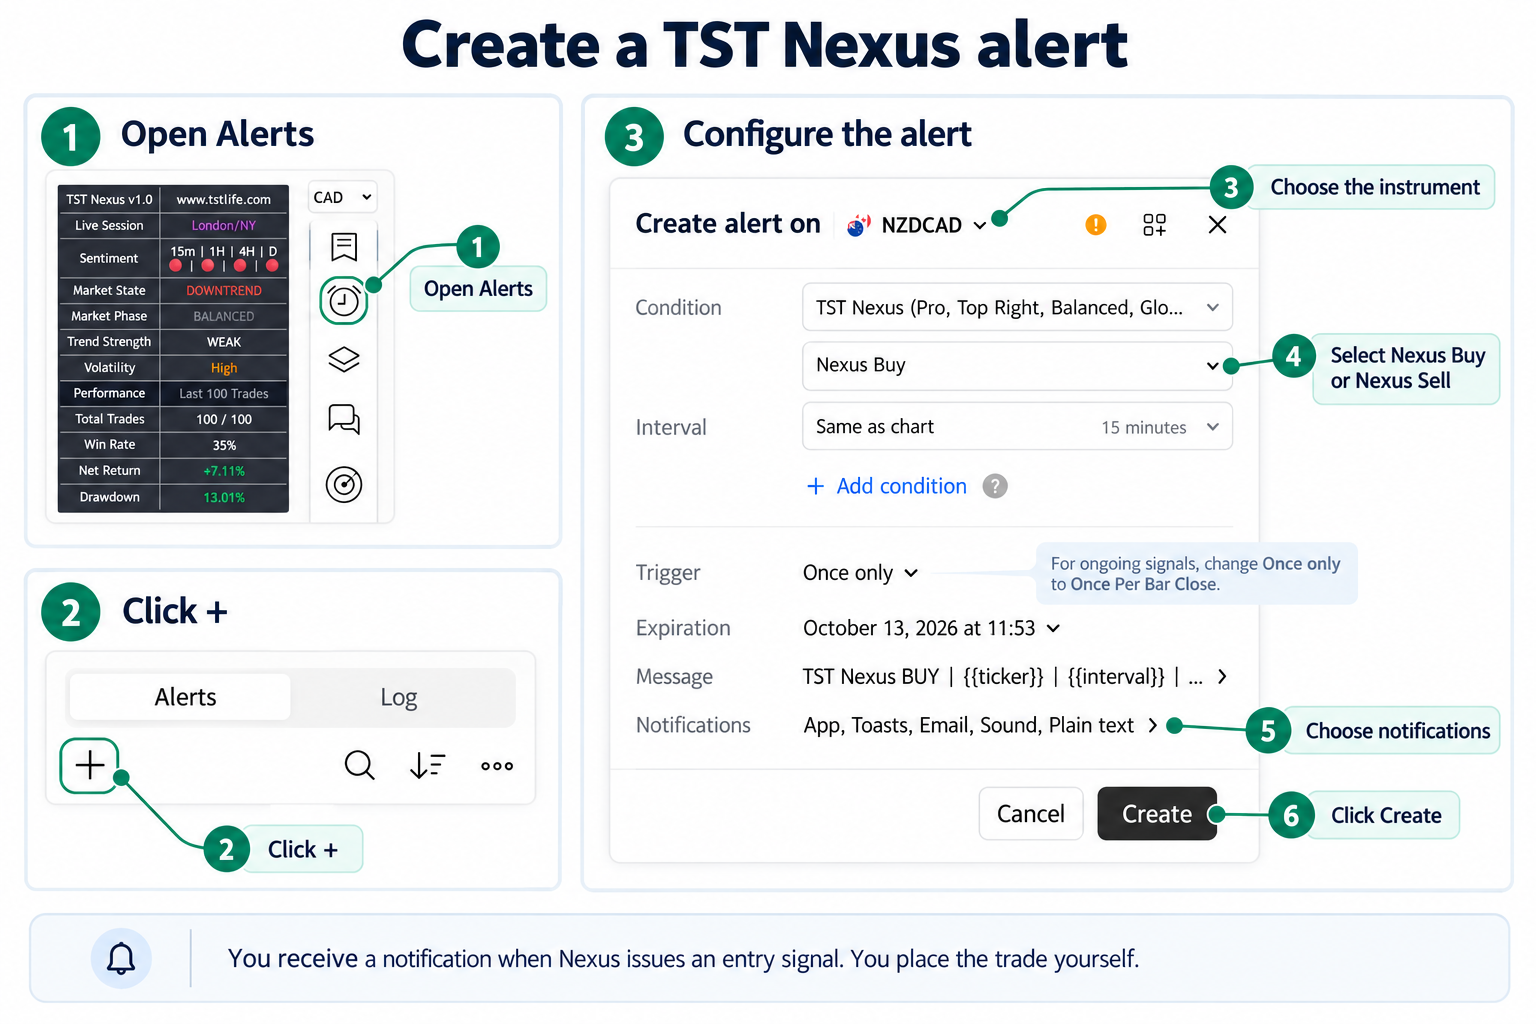
Set up automated TradingView alerts so you never miss a confirmed setup even when you are away from your screen. Follow these numbered steps to configure your alerts:
- Open the TradingView Alerts panel by clicking the clock icon in the top toolbar (or pressing Alt + A).
- In the Condition dropdown, select TST Nexus.
- Create Buy and Sell alerts separately: First select Buy Signal to set up your long alert. Repeat these steps to create a separate alert for Sell Signal.
- Under Trigger, choose Once Per Bar Close. This ensures the candle has finished forming and the signal is completely confirmed before an alert fires, preventing premature alerts from intra-candle price swings.
- Select your desired notification options (TradingView App notification, Desktop pop-up, Email, or Webhook URL) and click Create.
Troubleshooting & FAQ
About TST Nexus
What is TST Nexus?
Is TST Nexus an automated trading bot?
Does TST Nexus guarantee profits or offer financial advice?
Access & Setup
How do I get access after joining?
Why don’t I see TST Nexus in my Indicators menu?
Do I need a paid TradingView account?
Using the Indicator
Which markets and timeframes work best?
What is the difference between Beginner, Balanced, and Pro modes?
Balanced: Offers moderate detail with key support and trend context.
Pro: Displays comprehensive structural analytics, advanced momentum metrics, and complete order block/range markers.
Why should I use "Once Per Bar Close" for alerts?
How should I manage Entry, SL, and TP levels?
Membership & Billing
How do I manage or cancel my membership?
What is the refund policy?
How do I contact customer support?
Need Direct Support?
Have questions about setting up TST Nexus, connecting your TradingView username, or configuring alerts? Choose any of our 3 support options below to get in touch with our team:
Email Support
Official inbox for account inquiries, partnerships, and technical assistance.
partnership@tstlife.com
Whop Chat Support
Live member messaging and ticket assistance directly inside your active Whop portal.
Telegram Support
Fast direct messaging and support updates via our official Telegram channel.